QBR Report
What is this?
The QBR report is a collection of dashboards, such as daily active users, connection rates, and the number of calls with voicemail drops. The suite of embedded reports included in the QBR Report are below.
Note: 🔄 Data in this report is updated daily at 8:30 A.M. UTC.
General reports
- Active License - Snapshot of the current number of active licenses per product.
- Daily Active Users - Day-by-day count of unique users who performed at least one meaningful in-product action during the selected date range.
- Number of Users Per Location - Total number of users per Location in your account.
RingDNA Communications Hub (aka Dialer) reports
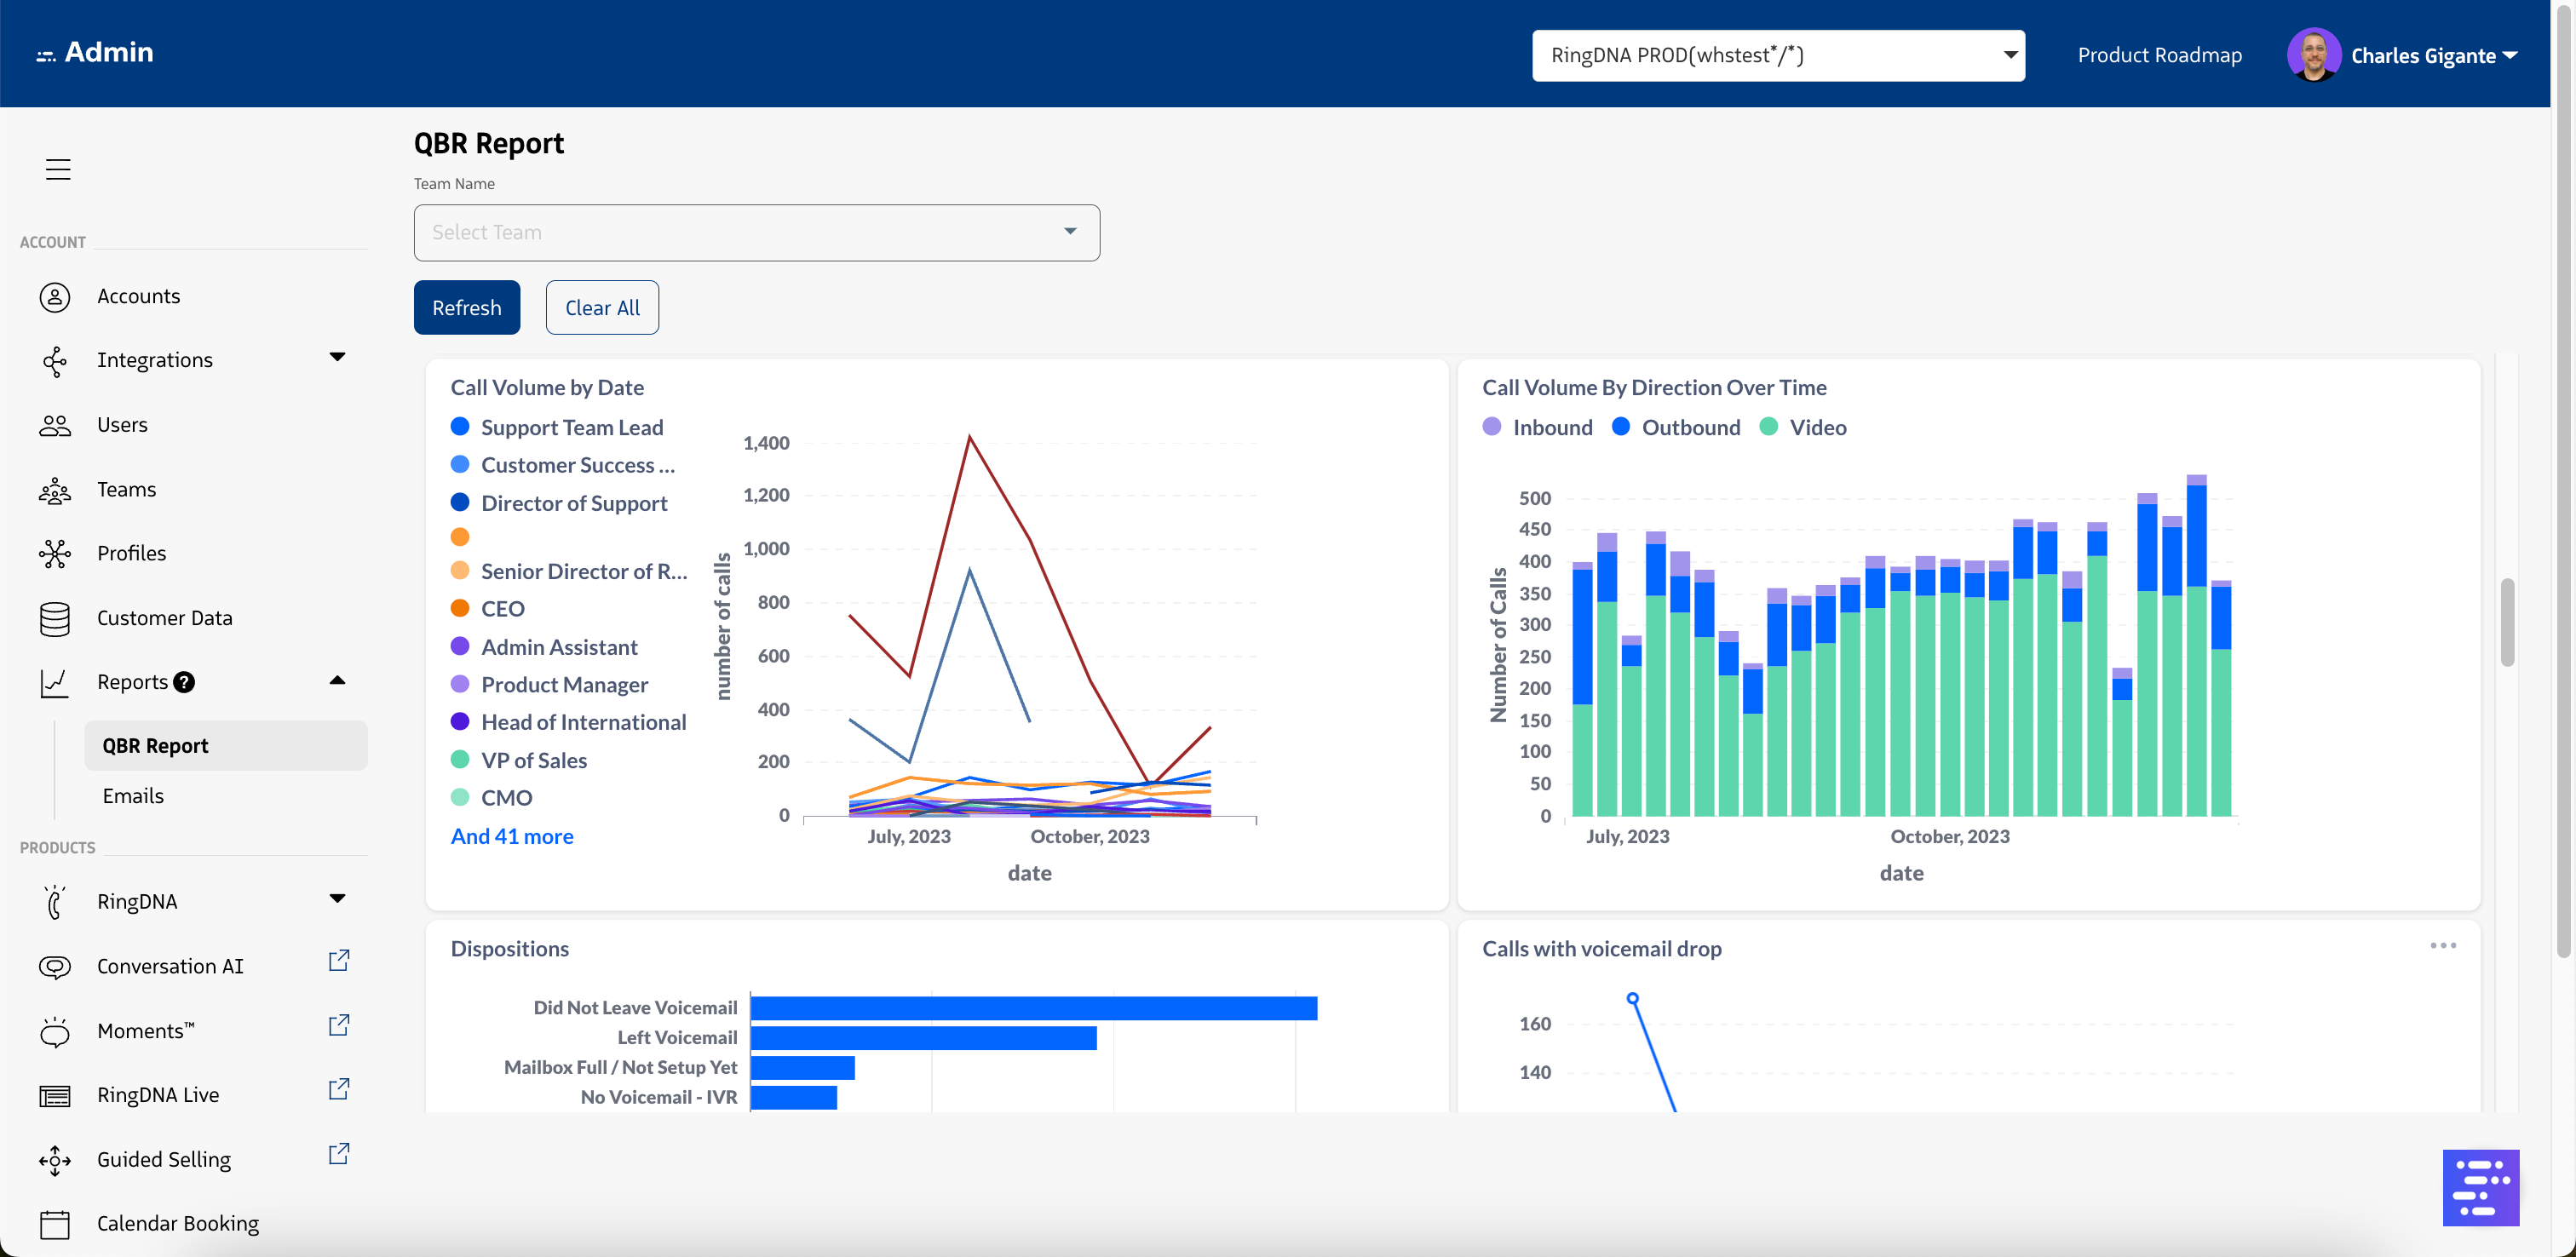
- Call Volume By Date - Call volume by user Title.
- Call Volume By Direction Over Time - Stacked bar chart detailing call volume by direction (inbound, outbound, and video)
- Dispositions - Bar chart of the number of each disposition used over the last 6 months.
- Calls with Voicemail Drops - Calls by user location that used the voicemail drop feature. Shown for the past 6 months.
- Calls with Notes - Bar chart displaying the number of calls with notes per month.
- SMS Sent - Number of SMS messages sent per month.
- Local Presence (by hours of day) - Bar chart detailing the number of calls placed (using and without using Local Presence) by hour of day over the last 6 months.
- Connection Rate - new - Line graph comparing the connection rate by time of day for calls utilizing Local Presence vs. without Local Presence. The hour of day is normalized to the timezone associated with the area code of the “to number”.
- Average Time Savings Per User - This report will average the utilization data of all users who have made a call within the last six months to calculate average time savings per user.
- Call Volume Per login By Direction Over Time - Average number of calls (inbound, outbound and video) per user login over the time period.
Conversation AI reports
- Recordings played - Number of recordings played in total each month.
- Time Spent Live Listening to Calls - Number of realtime listen-ins and the average time per listen.
Daily Active Users report
The Daily Active Users report gives you a day-by-day view of how many users on your account are actively engaging with Revenue.io. For each day in your selected date range, the report reflects the number of unique users who performed at least one meaningful action in the product, giving you an accurate picture of adoption and usage across your team.
How active users are counted
A user is counted as active on a given day if they performed at least one qualifying action during that day. Activity is evaluated per user, per day, so a user who is active across five days appears in the count for each of those five days.
The report rolls up activity at the account level, making it easy to track overall team engagement and spot trends over time.
Qualifying activity events
The following actions are recognized as evidence that a user actively engaged with the product:
| Activity | What it represents |
|---|---|
| Login | The user authenticated and accessed the app. |
| Dial Next | The user advanced through a calling workflow. |
| Smart Recording Played | The user played back a recorded conversation. |
| Conversation Player Interaction | The user played or paused a conversation in the conversation detail view. |
| AI Summary Expanded | The user engaged with an AI-generated call summary. |
| Lead Status Changed | The user updated a lead status, indicating a CRM workflow action. |
| Compliance Announcement Played | The user was active during a call with a compliance disclosure. |
| Presence Status Changed | The user updated their availability status, indicating they accessed and interacted with the app. |
What is not counted
The following actions are intentionally excluded from the active user count:
- Logout and forced logout events — these indicate session termination, not product use
- Administrative and configuration changes — these reflect setup and management activity, not end-user engagement
- Automated or system-generated events — background processes that occur without user interaction
- Invalid or expired session events — these do not represent real activity
Excluding these event types ensures the report reflects genuine, human-initiated product usage and is not inflated by system activity or administrative actions.
Frequently asked questions
| Question | Answer |
|---|---|
| Why doesn’t this report match our login count? | Sessions in Revenue.io can remain active for multiple days without requiring a new login. A user who logs in on Monday may still have an active session on Wednesday without logging in again. The Daily Active Users report captures whether a user actually engaged with the product each day, independent of when they last authenticated. |
| Can a user be counted more than once in a single day? | No. Each user is counted at most once per day, regardless of how many qualifying actions they perform. The report reflects unique active users per day. |
| What date range can I use? | The report supports any custom date range available within the reporting interface. Activity is aggregated by calendar day based on your account’s time zone settings. |
Why is this important?
Managers can get a quick pulse check into their team’s adoption and utilization of the Revenue.io platform. Along with your CSM, they can provide insight into areas of adoption that can be improved to drive even more value from the suite of functionality in the hands of your reps.