Interactions
The Interactions report tracks how reps engage with Moments™ notifications that were triggered by a spoken keyword or phrase. The question it answers: when a notification fires, did the rep complete it?
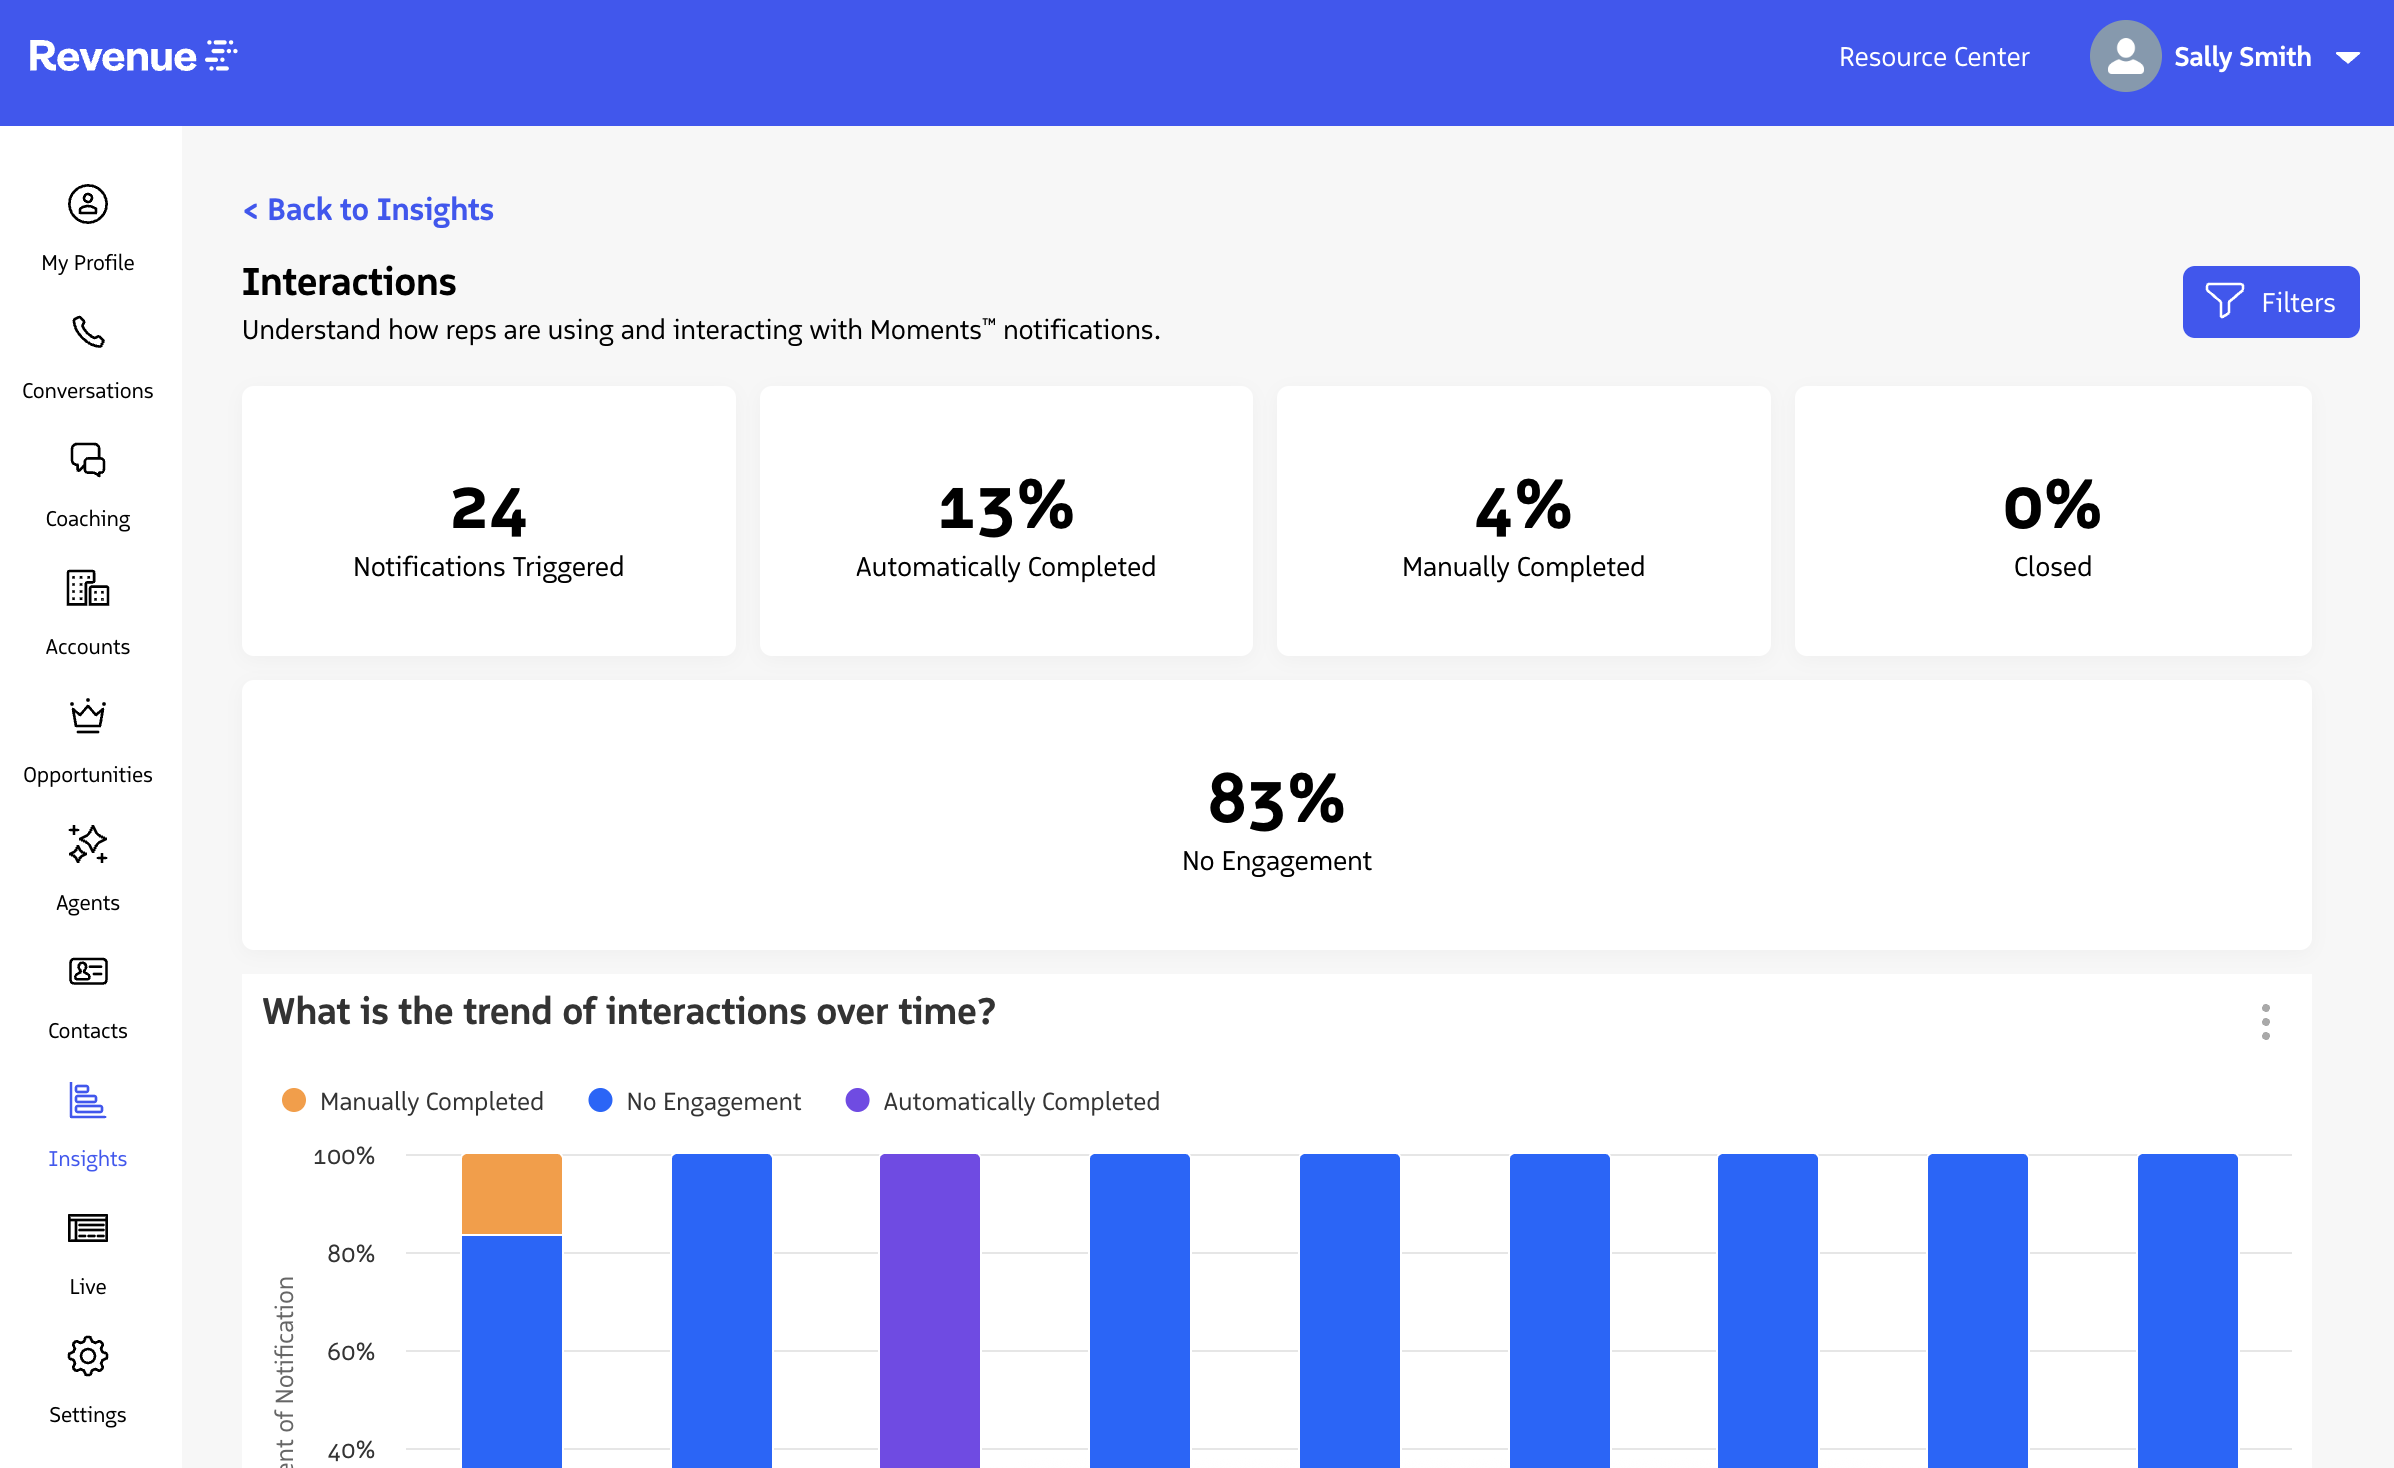
This report only includes notifications triggered by a spoken keyword or phrase. Interaction data for other trigger types — such as time-elapsed, talk rate, monologue, or interruptions — is intentionally excluded because those notification types don’t have the same rep-action relationship (the rep can’t “complete” a notification triggered by silence, for example).
What insights can I draw from the report?
You can leverage the Interaction report to:
- Evaluate notification usefulness — The stat metrics and agent comparison chart show whether agents are acting on the notifications you’ve built, which can help you refine or retire underperforming rules.
- Track engagement trends over time — The trend of interactions over time chart shows whether engagement is increasing or decreasing across your team over the selected period.
- Compare performance across agents — The interaction per agent chart surfaces which agents are completing (manually or automatically), or ignoring notifications, useful for coaching conversations.
- Assess individual notification effectiveness — The interaction engagement by notification table shows which rules are getting the highest rate of agent completion.
What is included in the report?
The dashboard contains a dynamic list of statistic cards and charts that highlight a full spectrum of insights into how reps are interacting with notifications that are based on an included phrase, time, or conversation etiquette behavior.
Statistic Cards
- Notifications Triggered - The total number of notifications triggered for the selected time period or applied filters.
- Automatically Completed - The percentage of notifications that are completed by using a notification completion phrase.
- Manually Completed - The percentage of notifications where a rep marked the notification as completed via the “Done” option within a notification.
- Closed - The percentage of time when a rep manually closed the notification via the “X” option within the notification card.
- No Engagement - The percentage of time when a notification was triggered and a user did not manually mark it as done or close it. These notifications would have been visible to the user during the conversation but not dismissed.
Charts
- What is the trend of interactions over time? - A time series chart that stacks the percentage of engagement of notifications over time.
- What is the interaction engagement by agent? - A chart that highlights the engagement rates of each rep within the applied filters.
- What is the interaction engagement by notification? - A table that highlights engagement stats on an individual notification basis.